Page 2 - NIRF_2017
P. 2

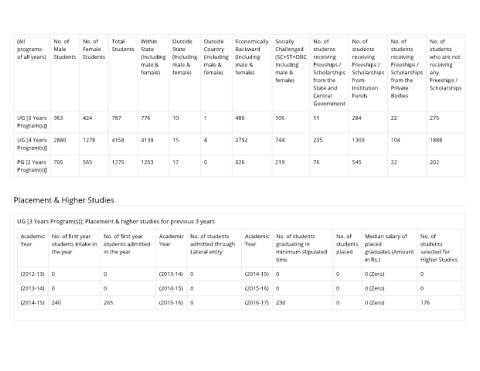
(All        No. of   No. of    Total     Within    Outside   Outside    Economically  Socially   No. of       No. of       No. of       No. of
       programs    Male     Female    Students  State     State     Country    Backward     Challenged  students     students     students     students
       of all years)  Students  Students        (Including  (Including  (Including  (Including  (SC+ST+OBC  receiving  receiving  receiving    who are not
                                                male &    male &    male &     male &       Including   Freeships /  Freeships /  Freeships /  receiving
                                                female)   female)   female)    female)      male &      Scholarships  Scholarships  Scholarships  any
                                                                                            female)     from the     from         from the     Freeships /
                                                                                                        State and    Institution  Private      Scholarships
                                                                                                        Central      Funds        Bodies
                                                                                                        Government


       UG [3 Years  363     424       787       776       10        1          486          106         11           284          22           275
       Program(s)]

       UG [4 Years  2880    1278      4158      4139      15        4          2792         744         235          1309         104          1888
       Program(s)]

       PG [2 Years  705     565       1270      1253      17        0          626          219         76           545          22           202
       Program(s)]


      Placement & Higher Studies


       UG [3 Years Program(s)]: Placement & higher studies for previous 3 years

        Academic  No. of first year  No. of first year  Academic  No. of students  Academic  No. of students    No. of   Median salary of   No. of
        Year      students intake in  students admitted  Year   admitted through  Year      graduating in       students  placed            students
                  the year         in the year                  Lateral entry               minimum stipulated  placed   graduates (Amount  selected for
                                                                                            time                         in Rs.)            Higher Studies

        (2012-13)  0               0                  (2013-14)  0                (2014-15)  0                  0        0 (Zero)           0

        (2013-14)  0               0                  (2014-15)  0                (2015-16)  0                  0        0 (Zero)           0

        (2014-15)  240             265                (2015-16)  0                (2016-17)  230                0        0 (Zero)           176
   1   2   3   4   5   6   7